Quantchabot has detected a new Bull Call Spread trade opportunity for OOMA INC (OOMA) for the 15-May-2026 expiration period. You can analyze the opportunity in depth over at the Quantcha Options Search Engine.
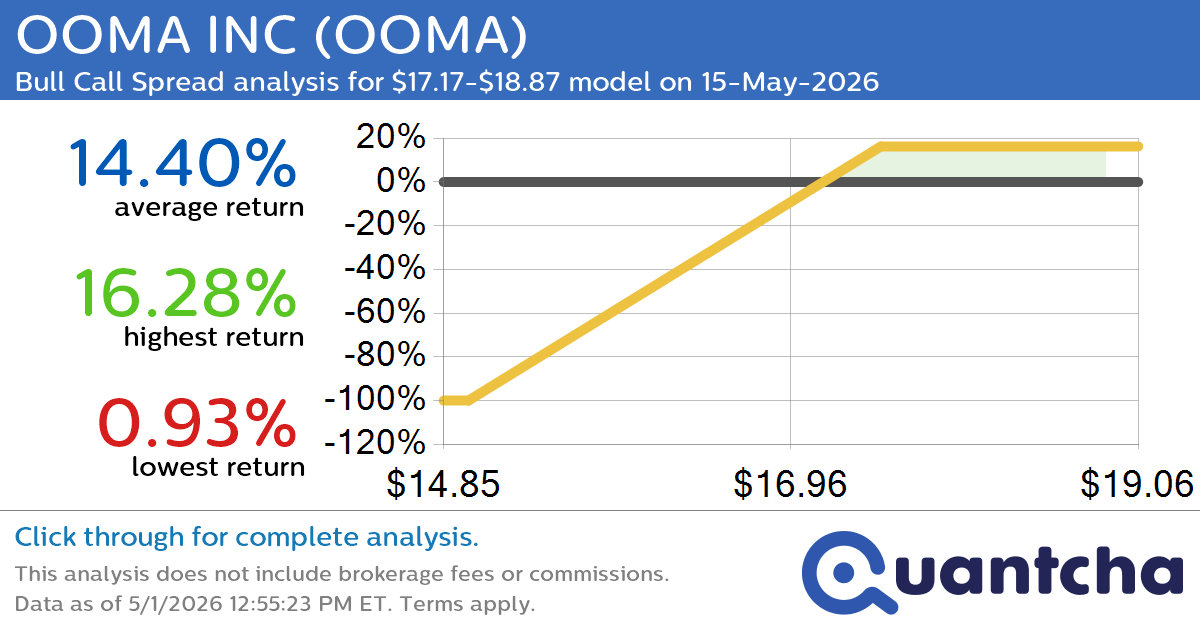
OOMA was recently trading at $17.14 and has an implied volatility of 47.23% for this period. Based on an analysis of the options available for OOMA expiring on 15-May-2026, there is a 34.27% likelihood that the underlying will close within the analyzed range of $17.17-$18.87 at expiration. In this scenario, the average linear return for the trade would be 14.35%.
52 week high: OOMA INC recently reached a new 52-week high at $17.19. OOMA had traded in the range $9.79-$16.89 over the past year.
Trade approach: Reaching a new 52-week high is a bullish indicator, so this trade is designed to be profitable if OOMA maintains its current direction and does not revert back to pricing on the bearish side of $17.14 on 15-May-2026. If possible, the trade has been padded such that slight movement against the trade would still return a profit.
Upside potential: Using this bullish strategy, the trade would be profitable if OOMA INC closes at or above $17.15 on 15-May-2026. Based on our risk-neutral analysis, there is a 50.39% likelihood of this return.
Downside risk: As with any options trade, there is a substantial downside risk where you may lose most or all of your investment.
To analyze this trade in depth, please visit the Quantcha Options Search Engine.
Leave a Reply
You must be logged in to post a comment.